A Gantt chart is a bar chart of a project's schedule. Each task is a row, time runs from left to right, and each task's bar starts on its start date and ends on its due date. Read across, it shows what happens when; read down, it shows what's happening at the same time, who is doing it, and which tasks are waiting for others to finish.
That one picture answers the questions a project's status meetings keep asking: are we on track, what's late, and if this slips, what slips with it. This guide covers the parts of a Gantt chart, a worked example you can copy, how to make one in six steps, when another view suits the work better, and how to build one in Redbooth.
The Parts of a Gantt Chart
Every Gantt chart has the first three. The rest are what make it useful for running a project, not just drawing it.
- Tasks. Down the left, one row per piece of work, often grouped into phases.
- The timeline. Across the top, in days, weeks or months, depending on how long the project is.
- Bars. One per task, from its start date to its due date. The length is the duration.
- Dependencies. Arrows from a task to the tasks that can't start until it's finished. They are what turn a list of dates into a plan: move one task and you can see what moves with it.
- Milestones. A date that matters rather than work that takes time, such as a launch, a sign-off or a delivery. Usually drawn as a diamond.
- Owners. The person responsible for each task, next to its name or on its bar.
- Progress. How much of each task is done, shown by filling in the bar. A bar that is less full than the time that has passed is a task running late.
- A today line. A vertical line at today's date, so everything to its left should be done.
- Summary bars. One per phase, from the start of its first task to the end of its last.
A Gantt Chart Example
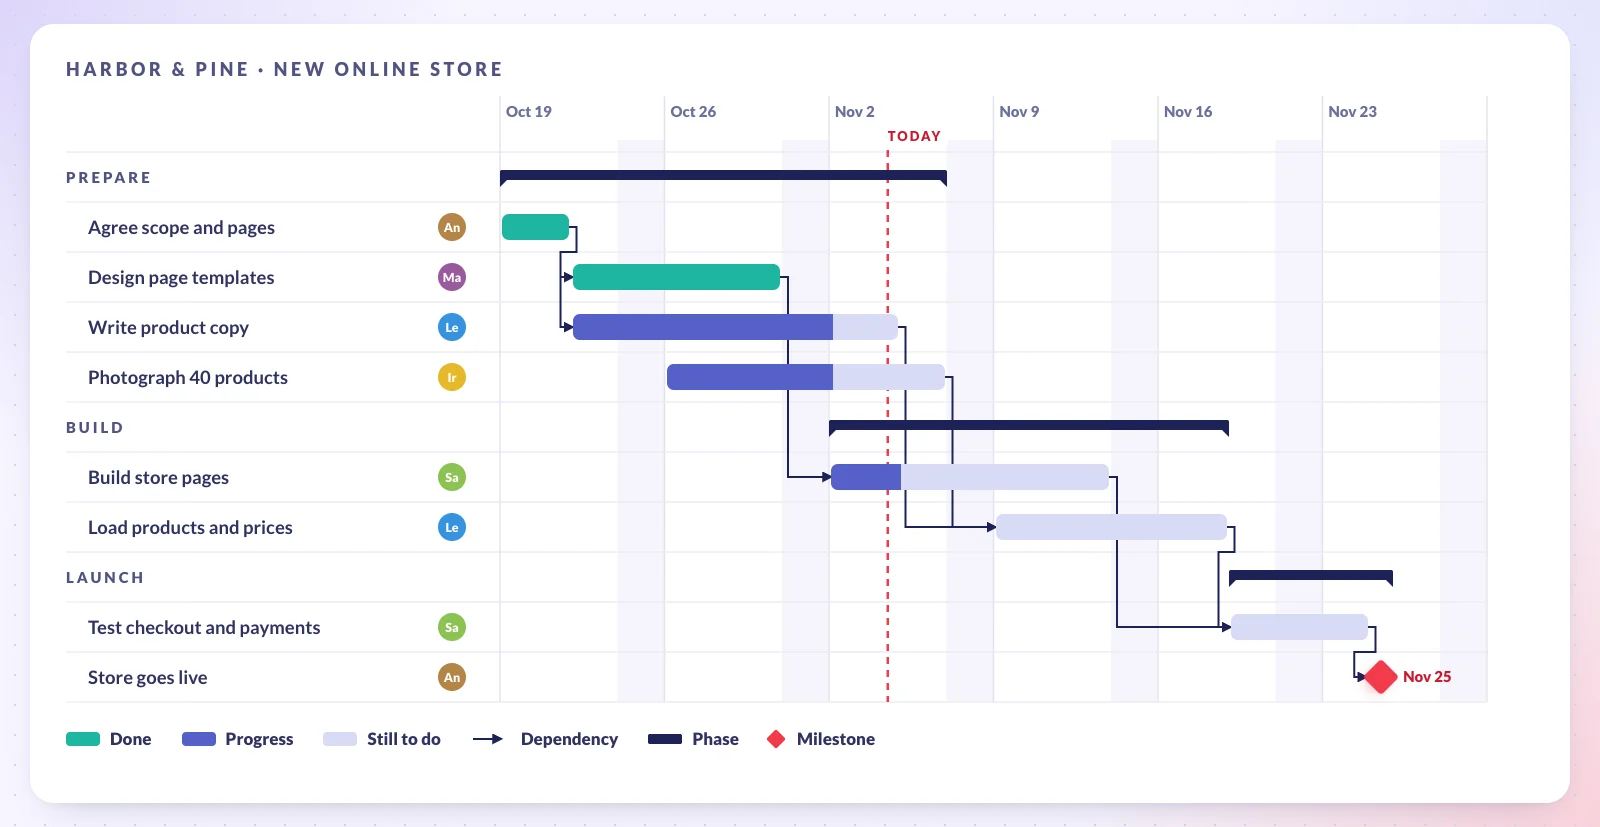
The chart above plans a six-week project for Harbor & Pine, a made-up furniture maker launching an online store before the holiday season. This is the task list behind it, the same table you'd write before drawing any bars:
| Task | Owner | Dates | Waits for |
|---|---|---|---|
| Prepare | |||
| 1. Agree scope and pages | Ana | Oct 19–21 | — |
| 2. Design page templates | Maya | Oct 22–30 | 1 |
| 3. Write product copy | Leo | Oct 22 – Nov 4 | 1 |
| 4. Photograph 40 products | Iris | Oct 26 – Nov 6 | — |
| Build | |||
| 5. Build store pages | Sam | Nov 2–13 | 2 |
| 6. Load products and prices | Leo | Nov 9–18 | 3, 4 |
| Launch | |||
| 7. Test checkout and payments | Sam | Nov 19–24 | 5, 6 |
| 8. Store goes live (milestone) | Ana | Nov 25 | 7 |
Here's what the chart tells you on November 4 that the table doesn't:
- The photos are behind. Iris's bar is 60% filled, and it's due on Friday. That matters more than it looks, because loading the products can't start until the photos are done.
- The launch hangs on one chain. Photographs, then loading the products, then testing, then the launch: there's no slack between them. That chain is the project's critical path, and a day lost anywhere on it is a day lost at the end.
- The design and build chain has room to spare. The store pages are due on November 13, but testing can't start before the 19th, because it also waits for the products. Sam's build could lose three working days without moving the launch.
- Leo has two tasks in a row. Product copy is due today and loading the products starts on the 9th. If the copy runs more than two days late, the loading slips too, and that's on the chain that sets the launch date.
How to Make a Gantt Chart in 6 Steps
- List the work. Start from what the project has to deliver and break each deliverable into tasks small enough for one person to finish in a few days to two weeks. Group them into phases.
- Estimate each task. Ask the person who will do it how long it takes, in working days. For work nobody has done before, give a range and plan with the middle of it.
- Mark what waits for what. For each task, ask: what has to be finished before this can start? Most projects only need finish-to-start links like these. Don't link tasks that could happen in parallel; it only makes the plan longer than it needs to be.
- Set the dates and owners. Put the first tasks on the start date and let the dependencies push the rest along. Give every task one owner, and check that nobody has two big tasks on the same days.
- Add the milestones. The launch, the client's sign-off, the day the printer needs the files. If the last milestone lands after the date you promised, now is the time to cut scope, add people or move the date, not halfway through.
- Keep it current. Update progress and dates once a week, in the same meeting, and look at the chain that sets the end date first. A Gantt chart that isn't updated is worse than none: people stop trusting it, and plan from their own lists instead.
When a Gantt Chart Helps, and When It Doesn't
Gantt charts suit projects with a fixed end date, work that has to happen in order, and handoffs between people: launches, events, construction, client projects, moving offices. They suit continuous work less, such as a support queue or a team shipping small changes every week, where nothing has a planned end and the order changes daily. There, a board shows more.
| Gantt chart | Kanban board | Roadmap | |
|---|---|---|---|
| Shows | Tasks as bars on dates, with dependencies | Tasks as cards in stages, such as To do, Doing, Done | Goals or themes across months or quarters |
| Answers | When will it be done, and what moves if this slips? | What's in progress, and where is work stuck? | What are we working toward, and in what order? |
| Best for | Projects with a deadline and handoffs | Ongoing work and short cycles | Explaining direction to people outside the team |
| Weak at | Work whose order changes every day | Dates and dependencies | Who does what, and when exactly |
Most teams don't have to choose. The same tasks can be a board for the people doing them and a Gantt chart for the person who has to say when it'll be done.
Excel, or a Project Management Tool?
Excel has no Gantt chart of its own. The usual workaround is a stacked bar chart whose first series, the start dates, is made invisible, so only the durations show as bars. It works for a plan you draw once and print. It doesn't show dependencies, so when one date moves, every date after it has to be changed by hand, and the chart only knows what the person keeping the spreadsheet last typed in.
In a project management tool, the chart is drawn from the tasks the team already works in. When someone finishes a task, the chart shows it; when a date moves, the tasks that depend on it can move too; and everyone looks at the same version instead of an attachment from last Tuesday.
A Short History
The first known chart of this kind was the harmonogram, drawn in 1896 by Karol Adamiecki, a Polish engineer. He published it only in Polish and Russian, so few people outside those countries heard of it. Henry Gantt, an American engineer, designed his own version around 1910 to 1915, first to track routine work in factories. One of its first big uses was by the United States in the First World War, and it kept his name. Personal computers made complex Gantt charts easy to draw in the 1980s, and today almost all of them are made in software. (Source: Wikipedia, "Gantt chart".)
Making a Gantt Chart in Redbooth
Redbooth's Gantt chart is the Timeline view of a workspace, on every plan including Free. You don't draw it: give your tasks a start date and a due date, open Timeline view from the icons at the top right of the workspace, and the chart is there.
- Phases are task lists. Each task list gets a summary bar, shaded to show how much of it is done. Redbooth has no separate milestone marker: a task list is how you mark one, and its bar ends on the due date of its last task.
- Colors show status. Active tasks are blue, overdue tasks red and finished ones green. Drag the ends of a bar to change its dates, or the whole bar to move it, and switch between days, weeks and months.
- Dependencies are on the Pro, Business and Enterprise plans. Hover over a task's bar and drag the orange dot on its right onto the task that waits for it. When you push a task's due date later, Redbooth offers to move every task that depends on it.
- Several projects at once: on Business and Enterprise, Timelines in the top bar puts the tasks from several workspaces on one timeline, filtered by workspace or by person.
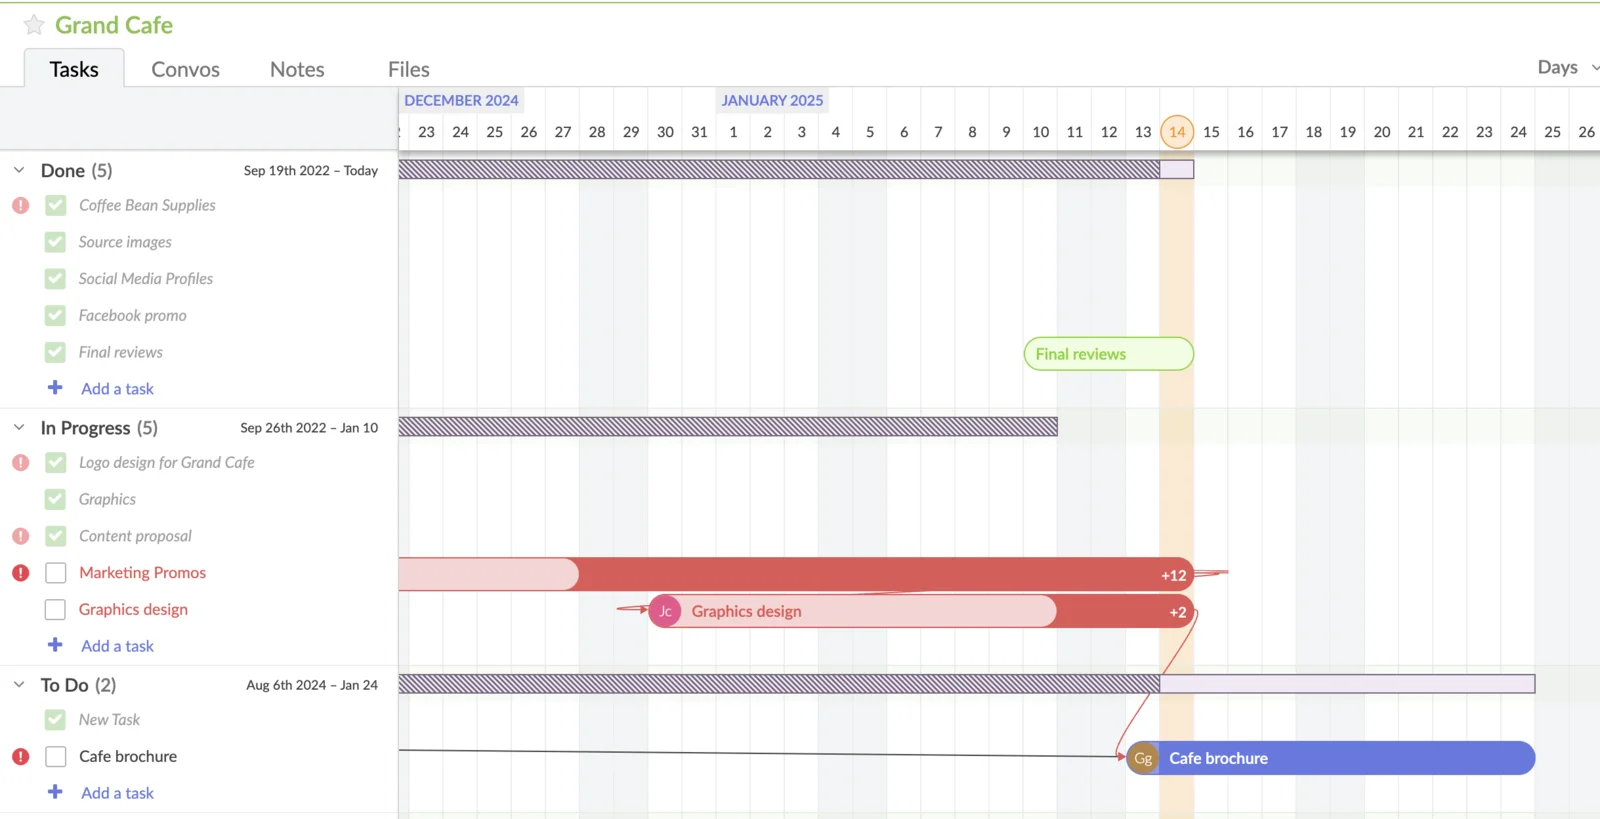
The screenshot is from Grand Cafe, a demo workspace with made-up tasks. Only tasks with both dates appear on the timeline, so a task that's missing usually needs a start date. The step-by-step guides are in our Help Center: Timeline View (Gantt) and Task Dependencies in Timeline View. For what the Timeline view does next to boards, chat and video, see the Gantt chart software page.
Questions People Ask
What is a Gantt chart used for?
To plan a project's schedule and then follow it: which tasks happen when, who does them, what depends on what, and whether the work is on track for the end date. It's also the quickest way to show a client or a manager when something will be finished.
What is the difference between a Gantt chart and a timeline?
A timeline marks events on dates. A Gantt chart is a timeline of tasks: each one has a duration, an owner and, usually, links to the tasks it waits for. Many tools, Redbooth included, call their Gantt chart a timeline view.
What is the critical path in a Gantt chart?
The longest chain of dependent tasks from the start of the project to its end. It sets the end date: delay any task on it and the project finishes later. Our guide to PERT and the critical path shows how to find it.
Can ChatGPT or Claude make a Gantt chart?
They can draft one: give them the goal and the deadline, and they'll suggest tasks, durations and dependencies, and write it out as a table or as code for a charting tool such as Mermaid. What they can't do is keep it current as the work moves. With Redbooth's MCP server, on Pro and up, an assistant can create the tasks, dates and dependencies in a workspace for you, and the Timeline view does the rest; our MCP use cases include turning a spreadsheet plan into one.
Has anything replaced the Gantt chart?
Not for projects with a deadline and handoffs. Agile teams plan with boards and backlogs instead, because their work comes in short cycles rather than one long schedule, and leadership often looks at a roadmap. But when someone asks "when will it be done, and what happens if this slips?", a Gantt chart is still the clearest answer.
To start your own, write the task table first: the work, the owner, the dates and what each task waits for. The chart comes out of that table, and so does most of the planning.