Most views in Redbooth are workspace-scoped — you open a project, you see that project's tasks. Swimlanes works differently. It pulls tasks from every workspace you have access to and lays them out on a two-dimensional grid: one field for rows, one for columns. The result is a single canvas that can show you things no other view in Redbooth can.
How to Get Started
Swimlanes is available from the main navigation bar. Click it, choose a field for rows and one for columns, and the grid populates immediately. You can swap the axes with a single click (the ⇄ icon) at any time, filter by assignee, tag, task list, workspace, or due date, and save your build as a named Swimlane View to access later.
With five fields available for each axis, the possibilities are expansive. Here are five of the most popular swimlane views.
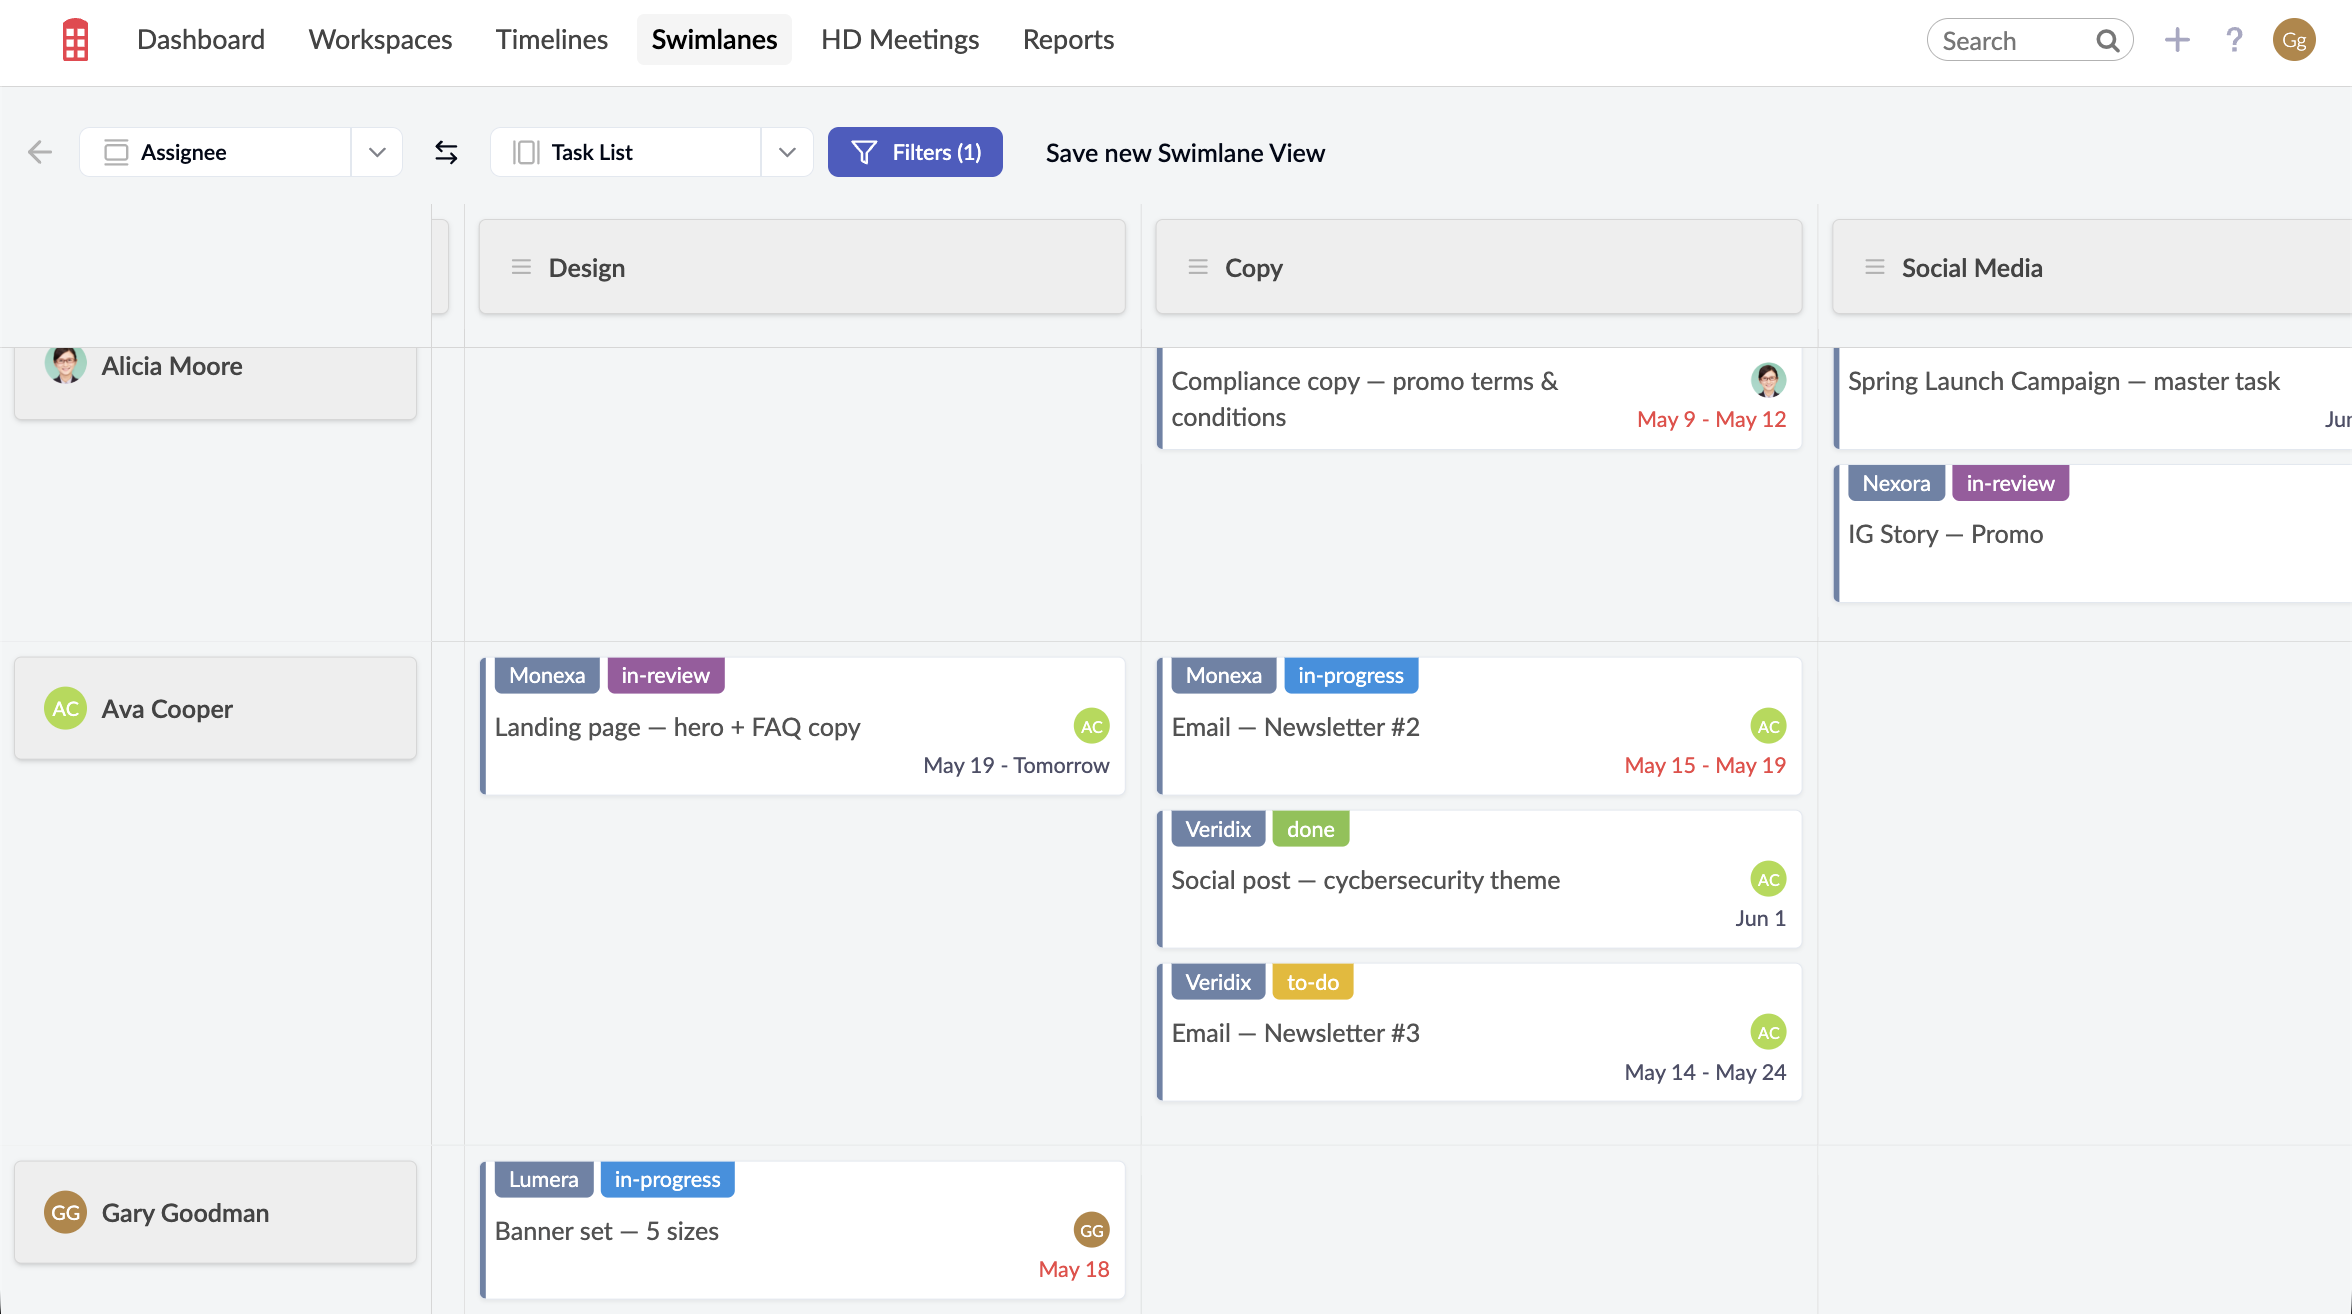
1. Team Workload Board — Assignee × Task List
Rows: Assignee | Columns: Task List
This is the closest thing to a complete picture of what each person on your team is working on right now. Every row is a person; every column is a task list (which in Redbooth usually maps to a phase or workstream within a project). The cells show that person's tasks in that particular list.
It's the view most teams open at the start of a weekly planning meeting. You can immediately see who has a lot on and who has capacity, which lists have no owner assigned, and where work is piling up. It also makes reassigning tasks straightforward — you can see the knock-on effect of moving something before you move it.
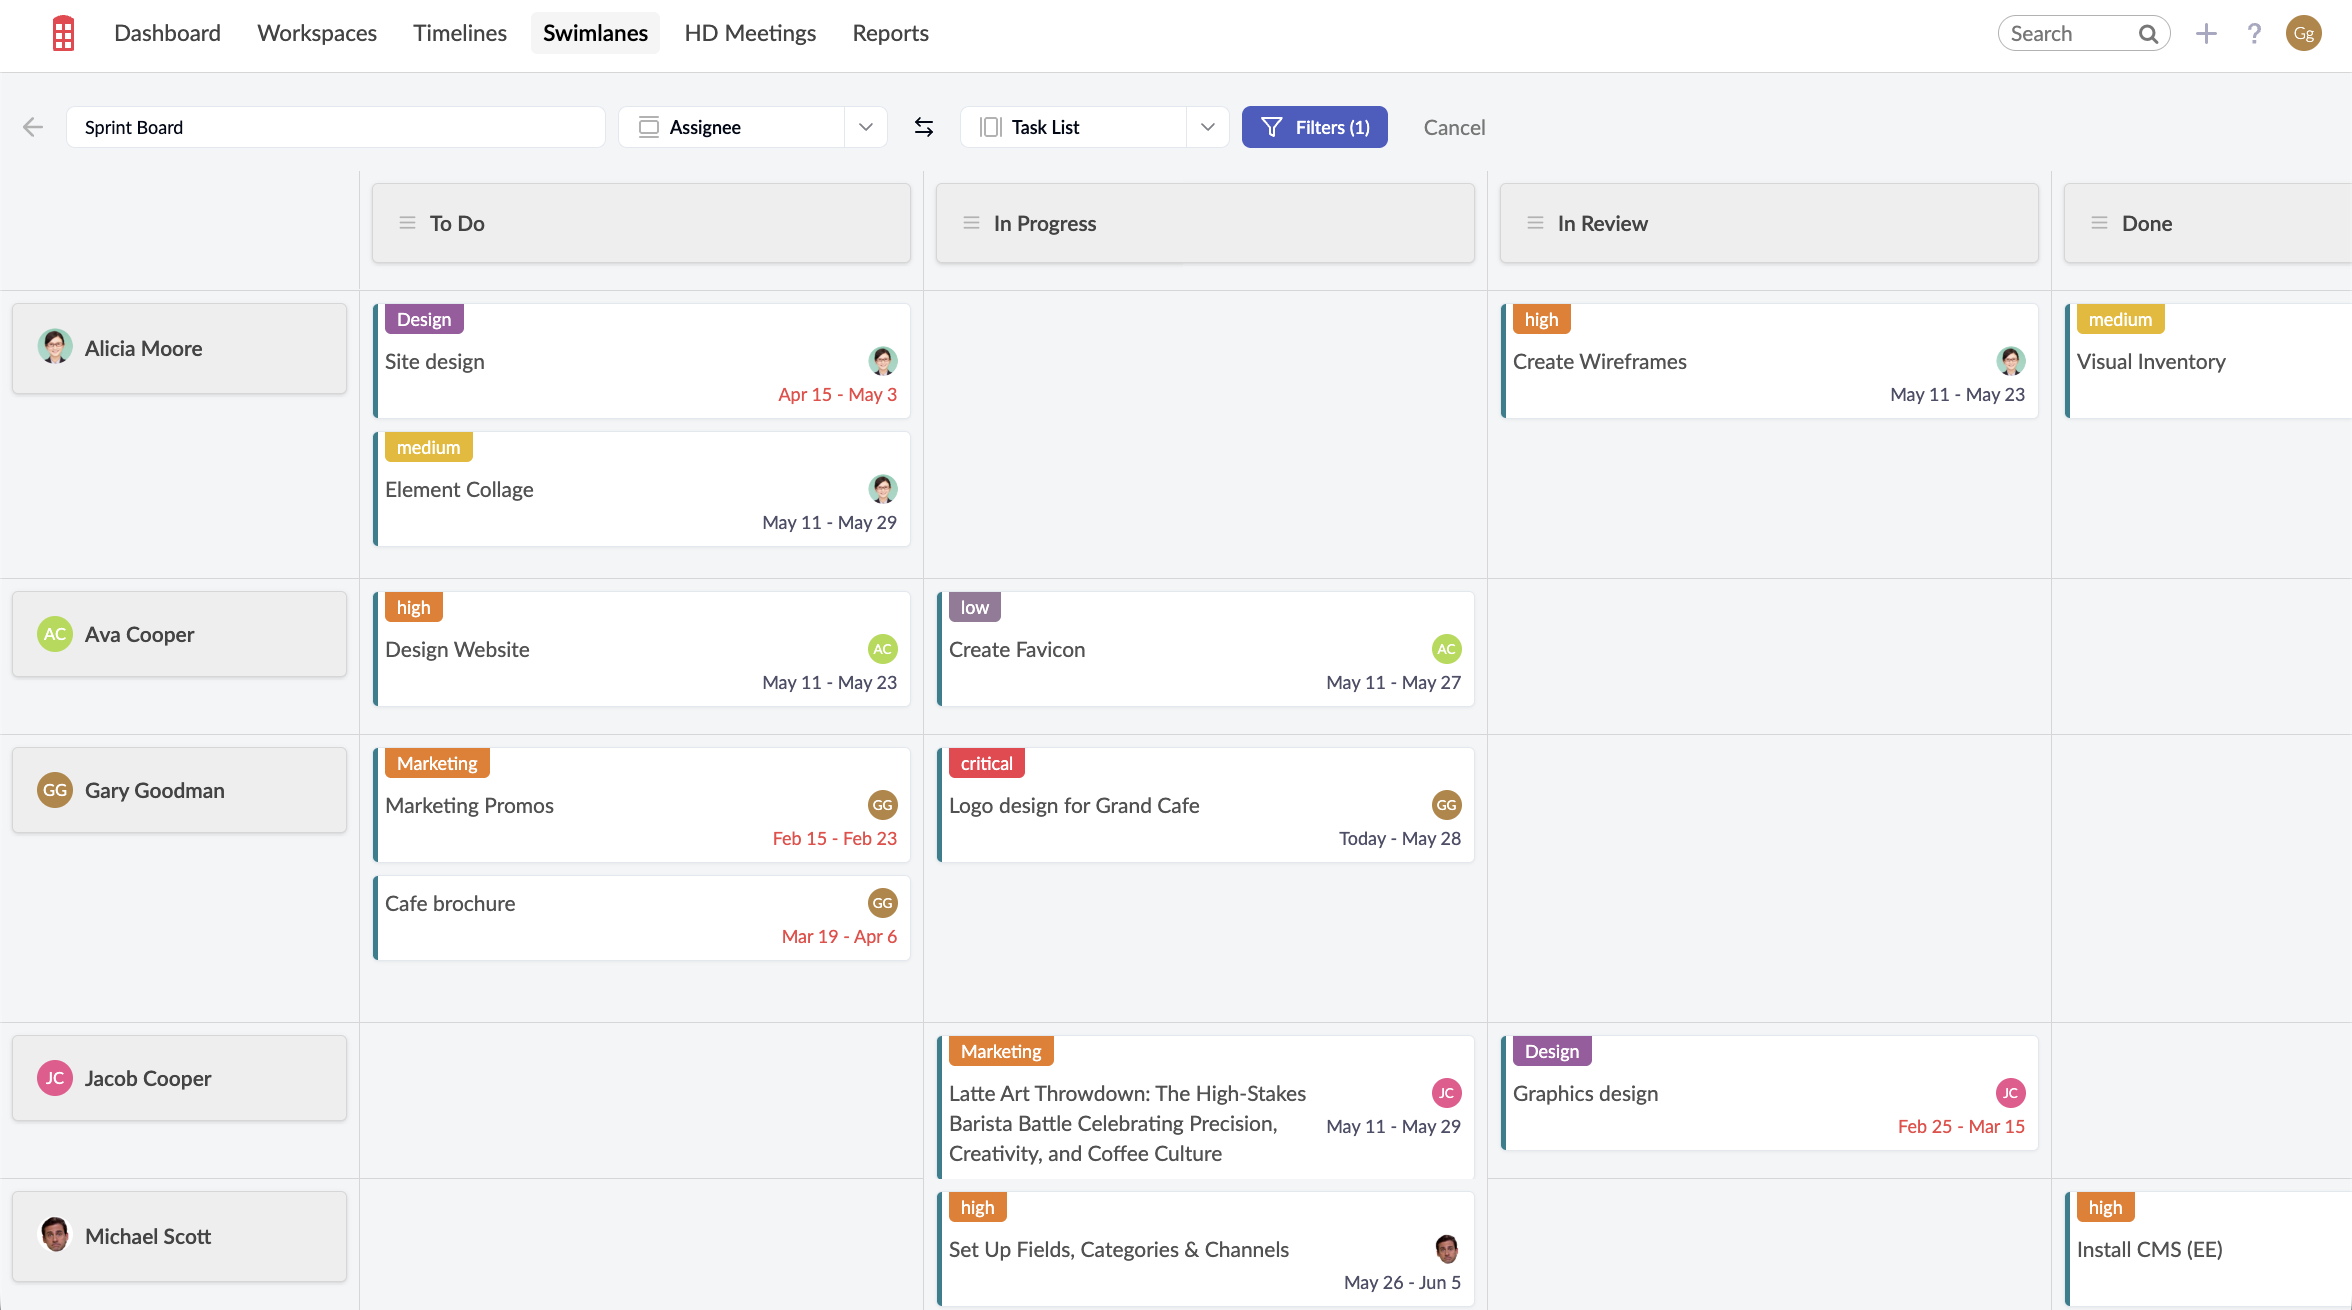
2. Sprint Board — Assignee × Task List
Rows: Assignee | Columns: Task List
Use this as your sprint planning board: filter your columns down to the task lists that belong to the current sprint, and you instantly have a grid showing exactly who owns what for this cycle. Unlike the workload board, which is best for an ongoing overview, this configuration is most useful when scoped with filters — limit to the two or three task lists in active development and the noise from the rest of the backlog disappears.
It's also a natural stand-up format. Walk down each row and each person can speak to their column-by-column breakdown. Empty cells are a conversation starter: either there's nothing to do in that phase, or something hasn't been assigned yet.
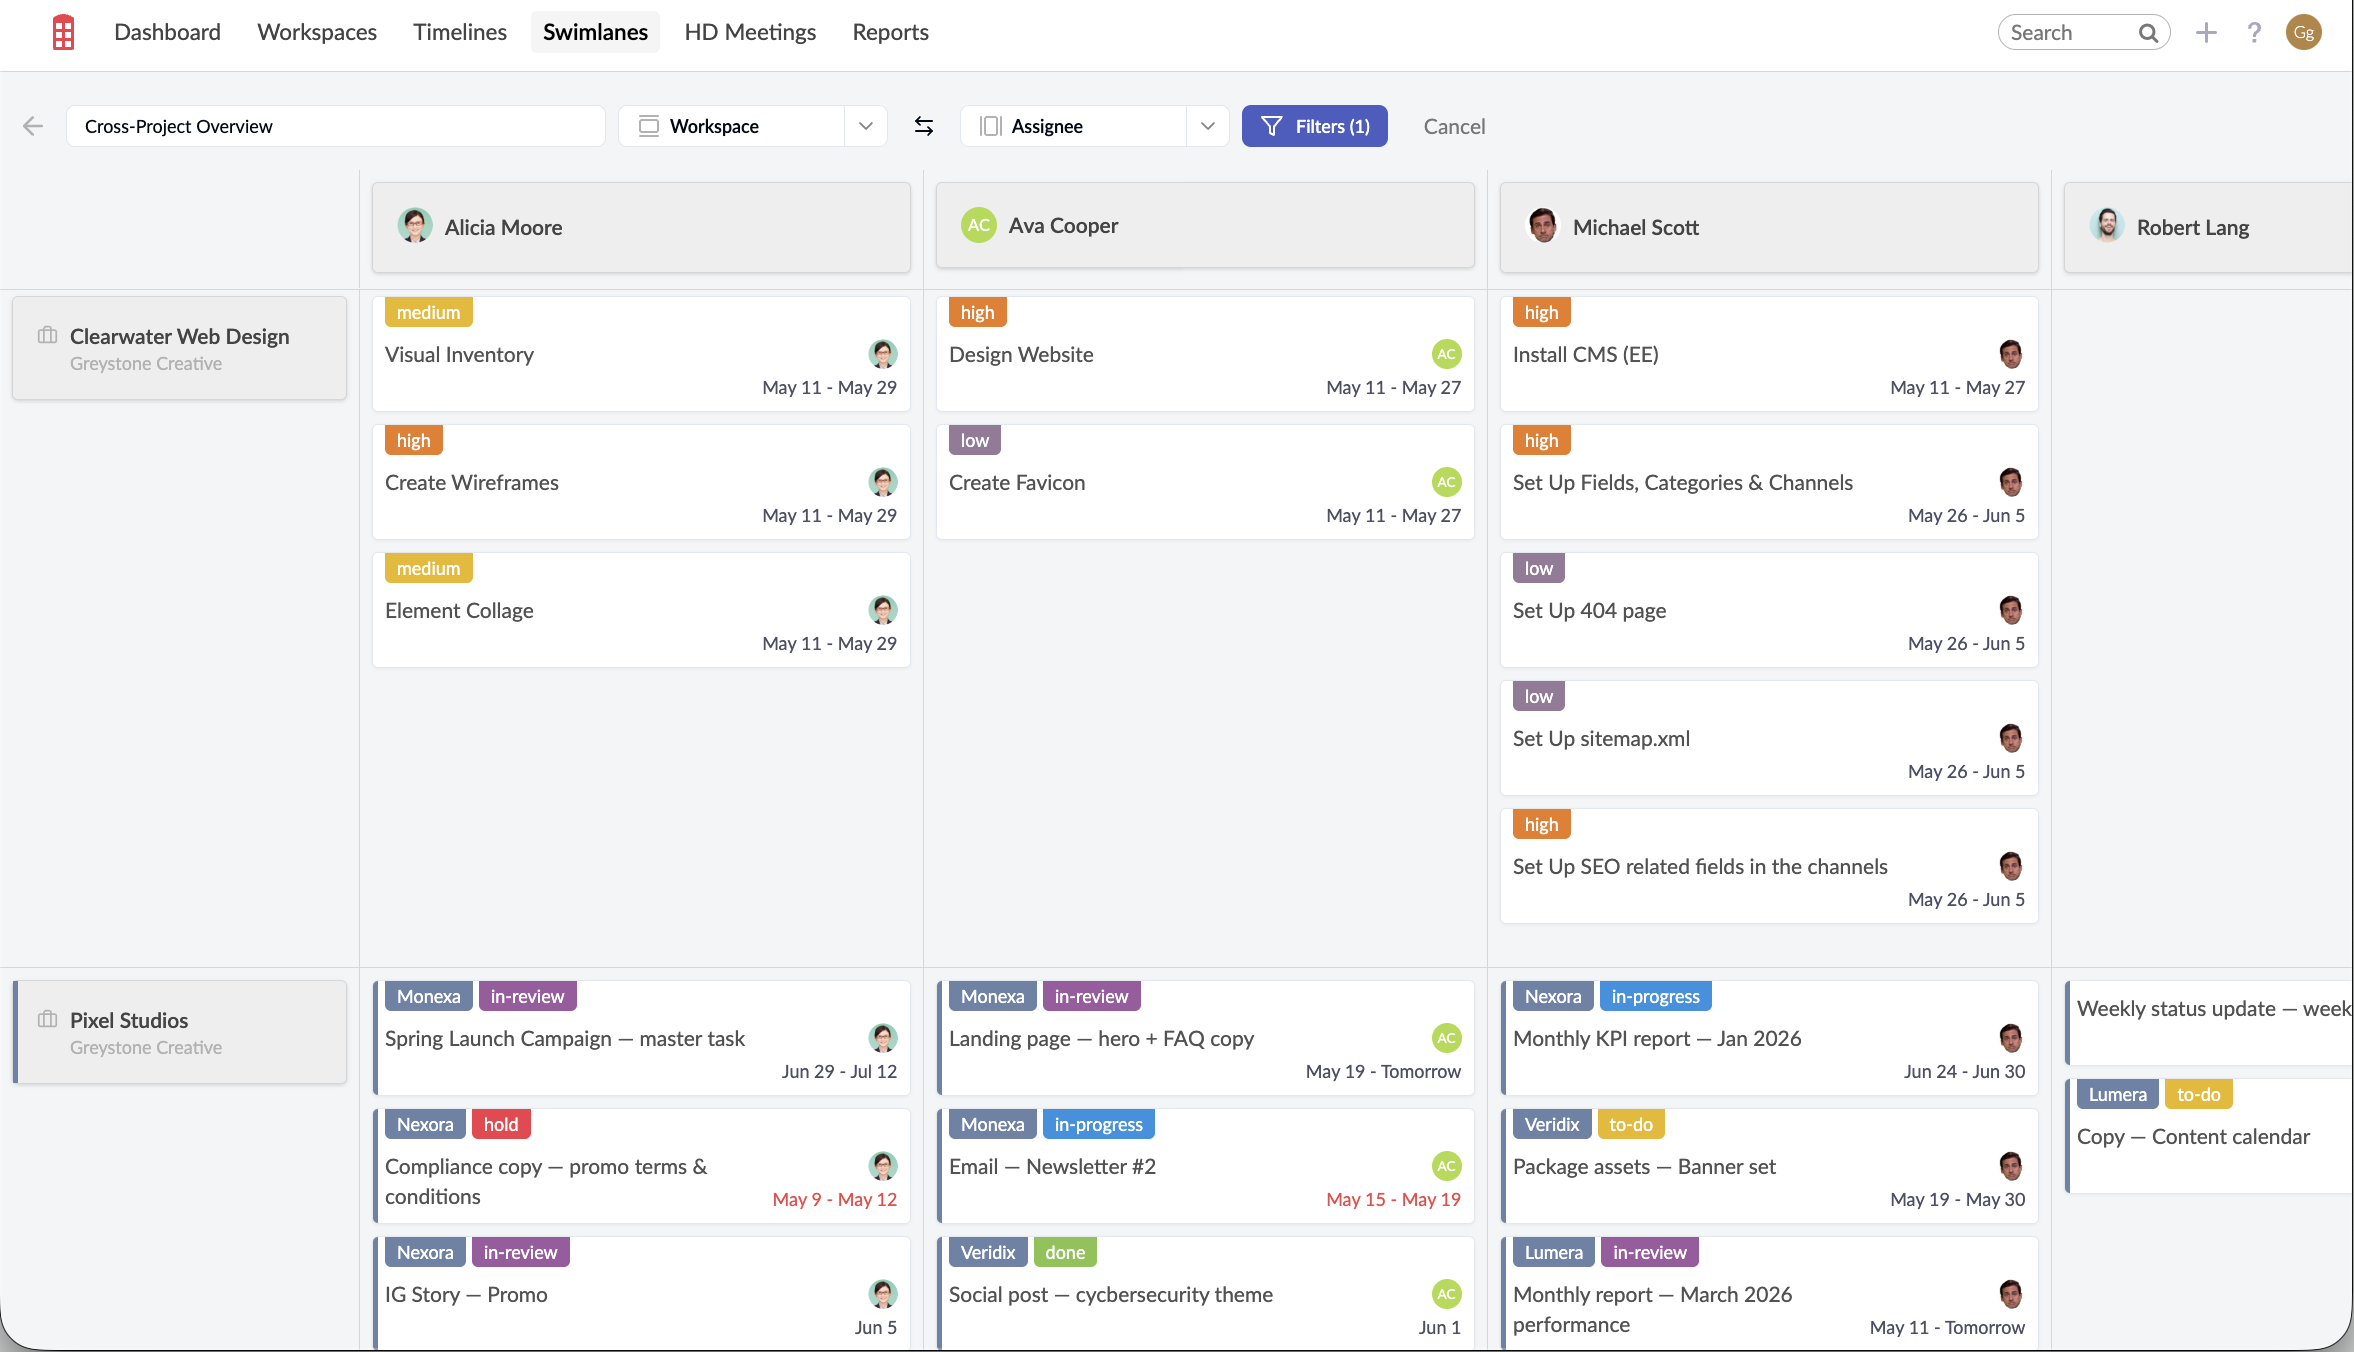
3. Cross-Project Overview — Workspace × Assignee
Rows: Workspace | Columns: Assignee
If your team runs multiple projects in parallel, this is the executive view. Each row is a workspace (project), each column is a person. You can see at a glance how each person's effort is distributed across your portfolio and whether any single project is leaning too heavily on one individual.
It's also the view Redbooth recommends for onboarding new team members. A new hire can open this, filter columns to just their colleagues, and immediately understand who owns what across every active project — context that would otherwise take weeks to build up.
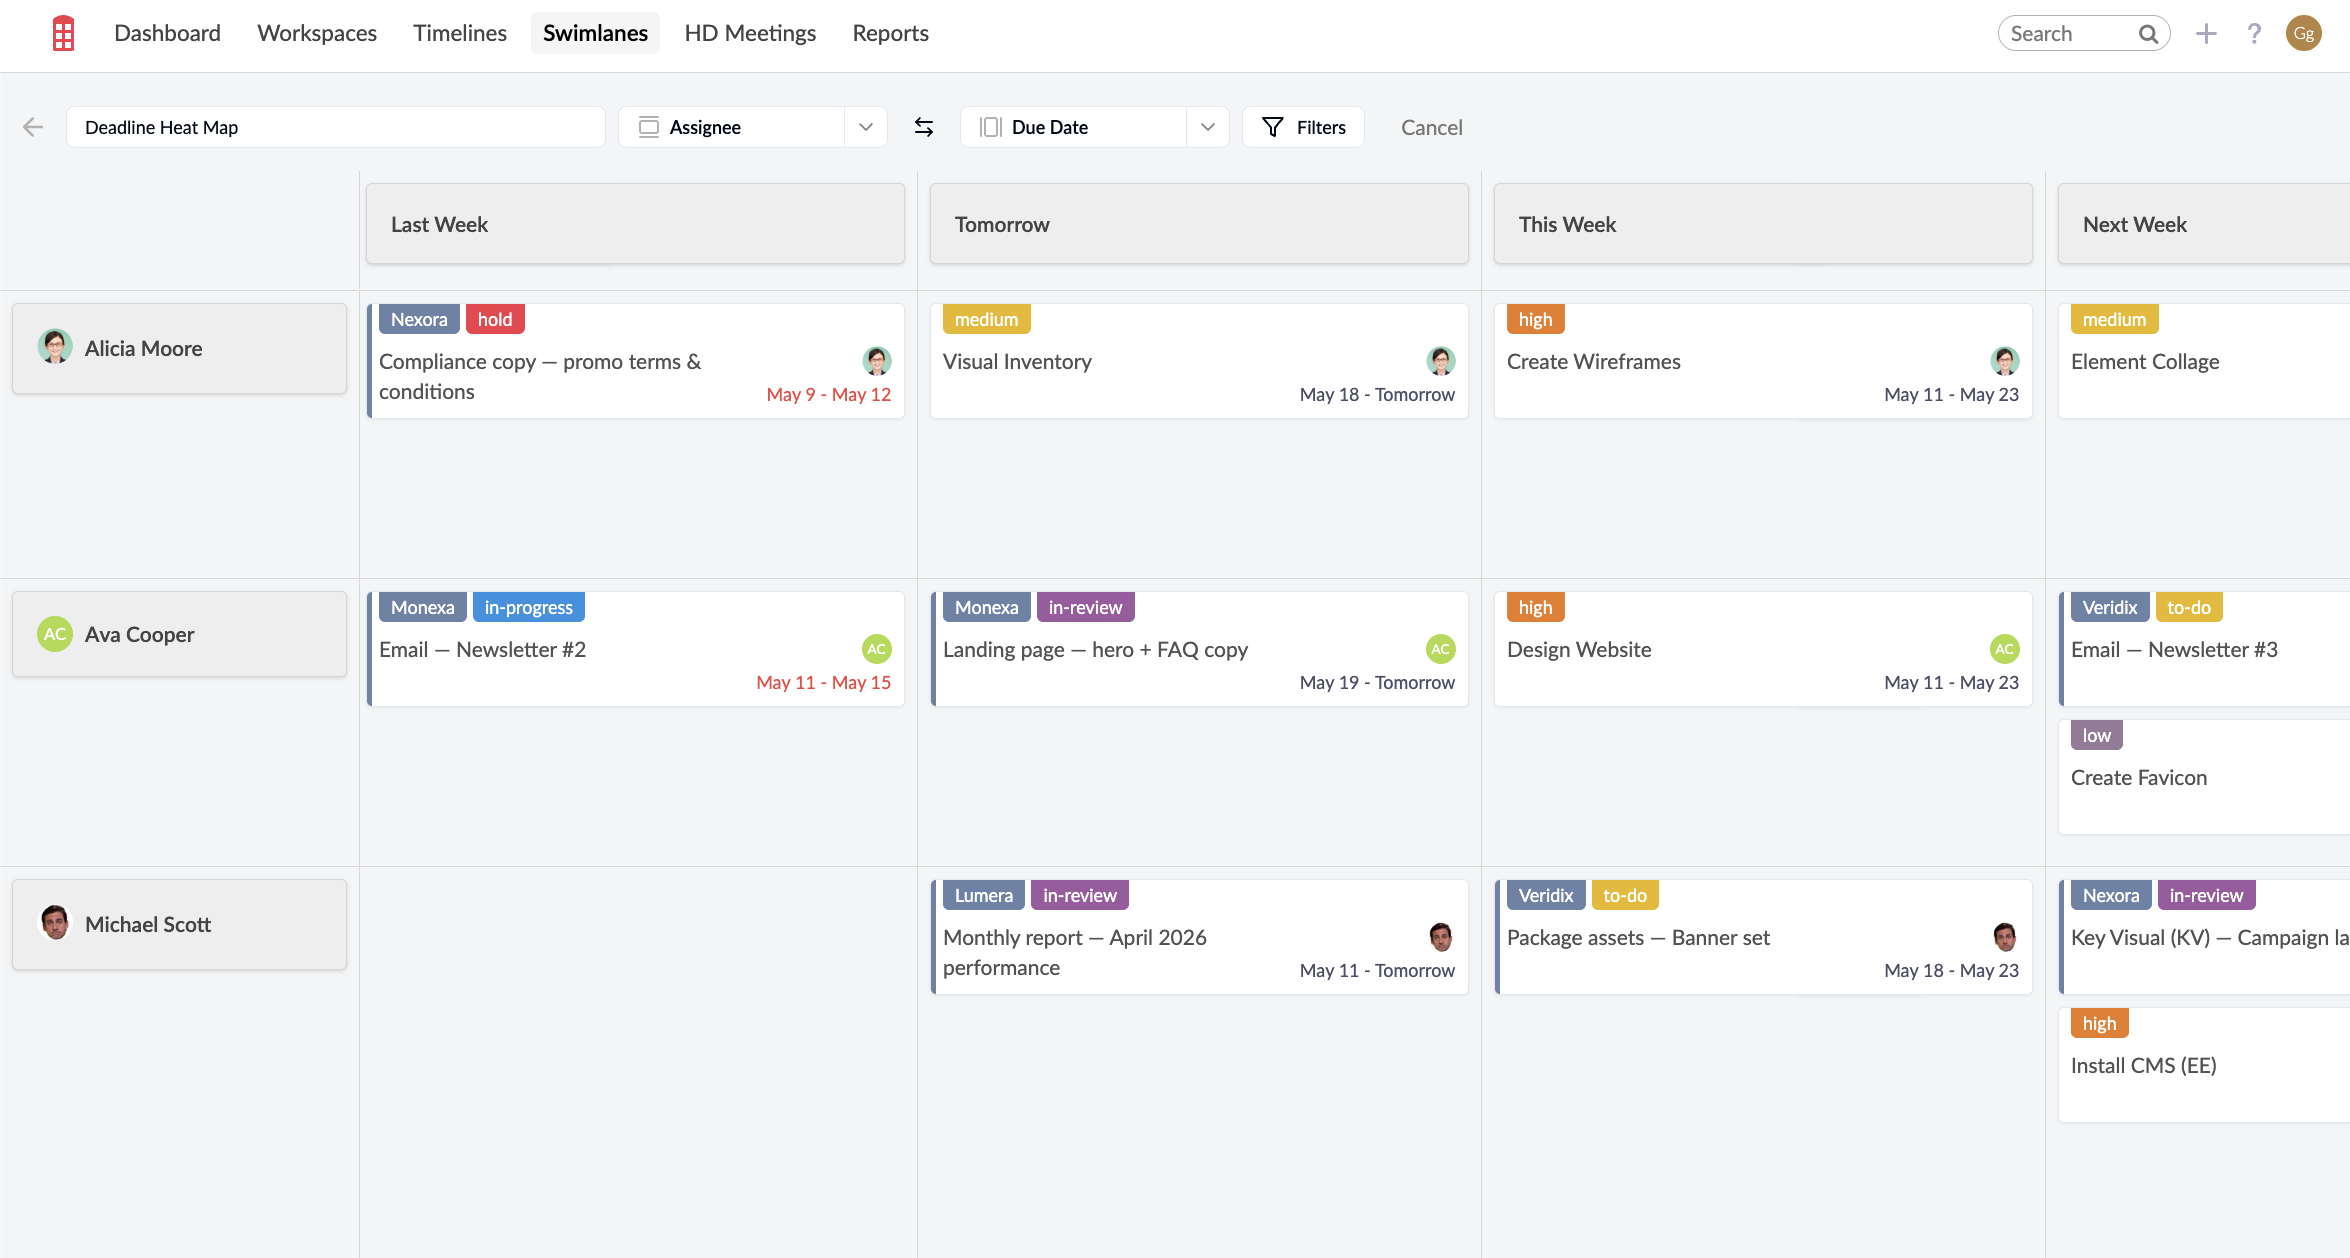
4. Deadline Heat Map — Assignee × Due Date
Rows: Assignee | Columns: Due Date
This one surfaces crunch points before they happen. Each column is a due date, and you can see exactly whose queue gets heavy on which day. A column that's tall for one row and empty for everyone else is a risk. A day where every column is full is a signal to either move something or escalate capacity.
Save this view with a filter for the current sprint or the next two weeks and pull it up whenever you're deciding whether to add something to the backlog. It's a faster gut-check than any spreadsheet.
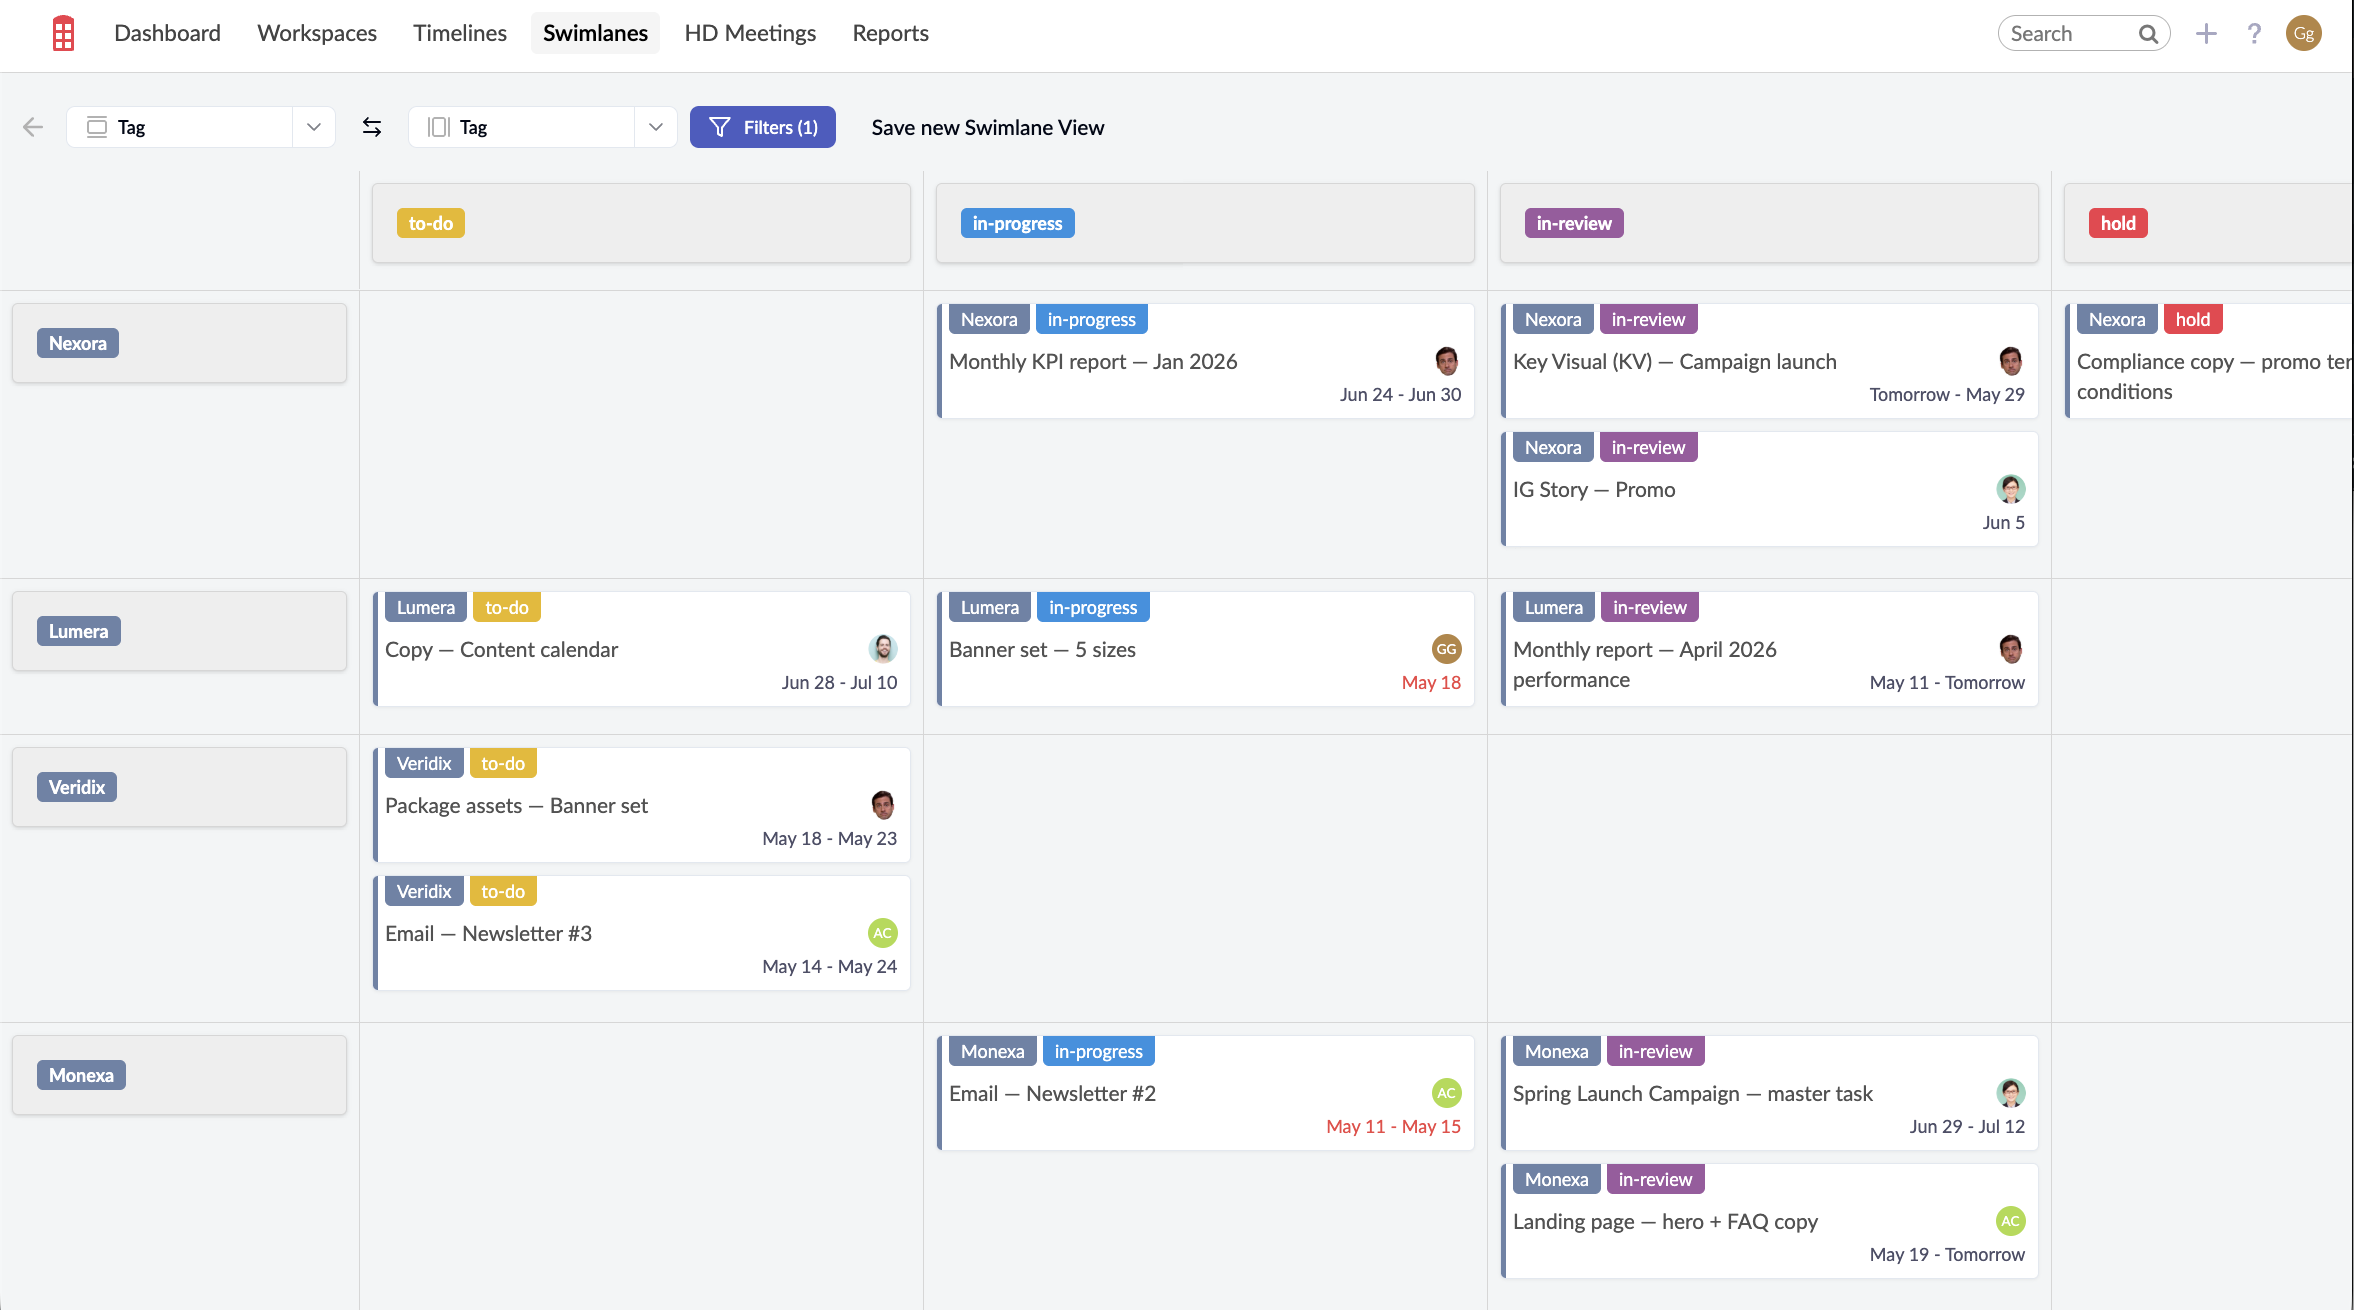
5. Client Status — Tag × Tag
Rows: Tag (client tags) | Columns: Tag (status tags)
Both axes can be the same field — and Tag × Tag is where that pays off. Set rows to your client tags (one row per client) and use the filter to limit columns to your status tags (things like "In Progress", "Awaiting Feedback", "Blocked"). The result is a client-by-status matrix: at a glance you can see which clients have work stuck in review, which have nothing in flight, and where things are moving cleanly.
This only works well if your tag groups are consistent. Keep client tags in one group and status tags in another, then use Swimlanes' tag group filter to isolate each axis. Once it's set up, save it as a named view and pull it up before every client status call — it replaces a spreadsheet most teams are maintaining manually.
A Note on Saved Views
Every configuration in Swimlanes — your row field, column field, and any active filters — can be saved as a named view. If you have a weekly planning meeting, a monthly reporting cadence, and a standing 1:1 with your manager, those are three separate views worth saving. Click Save new Swimlane View in the toolbar, give it a name, and it'll be there the next time you need it. You can also edit saved views at any time — adjust the fields or filters and save your changes without creating a new view.
For more on setting up and navigating Swimlanes, see our Swimlanes guide.