Behind the Scenes: Designing Gantt for Redbooth
At Redbooth, we’re in the process of building new Gantt chart capabilities for our project management software. Our mission: Build it from scratch so that it meets the real-life business needs of our customers (you can read more about that here).
As the lead designer for Redbooth’s new Gantt experience, I want to take you behind the scenes of the design process, from customer input to sketches to early design prototypes.
Breaking news: Timeline view is now live in Redbooth! Get all the details »
The Gantt-astic journey began even before my pen touched the paper…
Lemme Hear It
Conducting Customer Research
The new Redbooth Gantt features we’re working on aren’t just being influenced by customer feedback — they’re actually being driven by customer vision. Prior to envisioning what Redbooth’s version of Gantt would be like, Irwin Kwan, the project lead, and I spent time going through customer feedback to understand what was driving their requests for a Gantt feature within Redbooth.
We chose a few customers to interview and invited them to “rant about Gantt” so we could better evaluate their needs and how they were currently visualizing project progress. Their chosen methods varied from whiteboards to Excel spreadsheets.
These discussions not only gave our customers the opportunity to share with us what was important to them, but provided valuable insider information that would inspire and drive my design decisions.

Gantt Touch This (oh-oh oh oh oh-oh-oh)
Understanding Gantt
Being a “fundamentals-are-the-building-blocks-of-fun” type of person, I wanted to dig deeper and really understand Gantt at its core.
Exploring various tools and plugins to understand how different products interpreted Gantt helped set the stage for meeting customer expectations. Most importantly, it gave me something to dissect and really ask the question “How can I make this better?”

Build It And They Will Come
Defining the Scope
With the information we’d gathered so far, it was time to distill what Gantt meant for Redbooth and our customers in particular. Irwin and I took over a conference room and started whiteboarding.
We created a list of features that we believed would be helpful in building Redbooth’s version of Gantt, specifically those that address the user need of visualizing project progress. These included features like start dates, task dependencies, and project milestones. We worked closely with our development team in Barcelona to define the related technical capabilities. (Stay tuned for more from our developers in a future post!)

1-2-3 Draw!
Sketches, Wireframes and Interactions
With customer insight, knowledge and a vision, NOW the sketching could begin! The first thing I thought was, “How can I transform a task list into a timeline view?” and thus my first sketch was born.
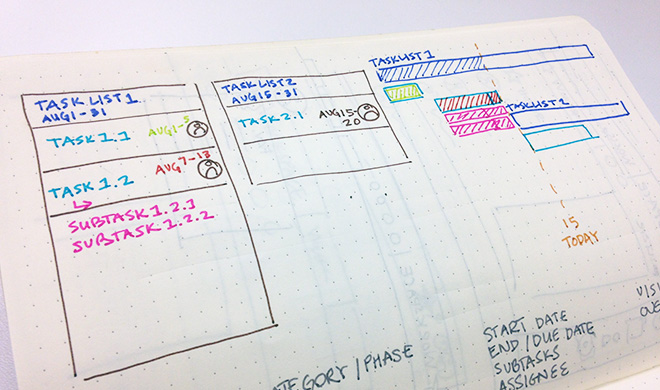
One of my major priorities for Redbooth’s Gantt is to maintain a clear connection to Redbooth’s familiar existing features and the behaviors our customers are accustomed to. My goal is to design a feature that is both valuable to our customers and easy to adopt and intuitive for anyone.

Mock-tales
Getting Feedback
After refining my sketches, I translated them into high-fidelity wireframes to share with the larger product team at Redbooth and the customers we previously interviewed. The team and our customers provided valuable feedback along with helpful ideas — and many of our customers were eager to start trying it out.
This stage was very important because we were able to give our customers the opportunity to provide feedback at a stage that was early enough to iterate from. We intentionally kept the designs rough so that we could easily incorporate what we learned.

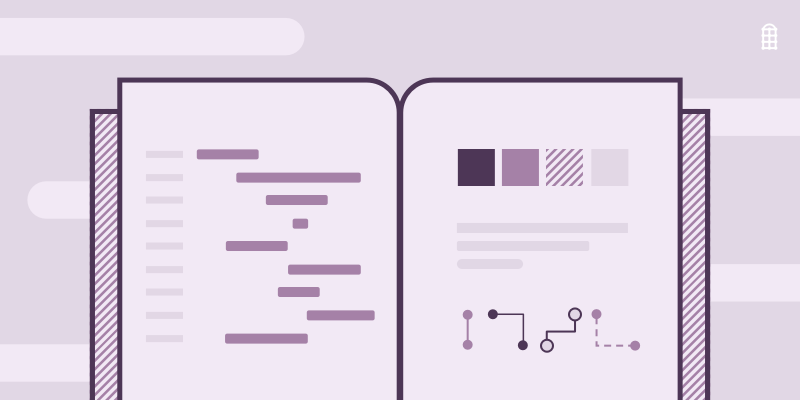
Colors, Patterns and Gantt, Oh My!
Defining Interactions and UI Components
After we confirmed with our customers that we were heading in the right direction, I continued to iterate on the design. I worked on refining the layout and styles, developing a color palette, and defining each Gantt component and the various interactions.

Gantt to the Future
Iterate, Prototype and Test
As our technical team works on transforming these design decisions into reality, our iterative process continues. We poke, play and test the live code so we can continue to fine-tune and improve the user experience before putting it back in front of our customers to beta test.
As the lead designer on this project, this challenge and process has been rich, exciting and inspiring. I’m excited to continue to collaborate with our team and customers as we build Gantt and look forward to sharing it with the rest of you!
Be sure to catch the next post in this series: Bringing Gantt Charts to Life: The Developer Perspective >>
Update: Instant Gantt charts have launched! Find out more »